
Not all customers are worth the same. Some buy once and disappear. Others return year after year, refer friends, upgrade to higher plans, and quietly become the backbone of your revenue. If you’re not tracking Customer Lifetime Value (CLV), you’re treating both groups identically – and that’s expensive.
CLV is the single metric that connects your marketing spend to long-term profitability. Here’s what it is, how to calculate it, and what to actually do with the number.
What Is Customer Lifetime Value?
Customer Lifetime Value (CLV) – also written as LTV or CLTV – is the total revenue you can expect from a single customer across the entire duration of their relationship with your business.
Not revenue from a single order. Not average monthly spend. The full picture: every purchase, renewal, upsell, and add-on from the day they first pay you to the day they churn.
CLV helps you answer a deceptively simple question: how much is a customer actually worth?
That question drives decisions across your entire business – how much to spend acquiring new customers, which segments to focus retention efforts on, and where your most profitable growth is hiding.
Why CLV Matters More Than Revenue Per Sale
Most businesses track revenue per transaction. That’s a start, but it misses the point.
A customer who pays €50 once is worth €50. A customer who pays €30/month and stays for 18 months is worth €540. If you’re optimising for the first metric, you might be spending your acquisition budget chasing the wrong people entirely.
CLV shifts the frame. Instead of asking “which customers buy the most right now?”, you start asking “which customers stay the longest and grow over time?” Those are often very different profiles.
It’s also essential for profitability math. There’s no point acquiring customers for €100 if they’re only ever going to generate €60. That’s a business that’s burning money on every sale.
How to Calculate Customer Lifetime Value
There are several ways to calculate CLV, from simple to predictive. Here’s the one that works for most SMBs:
Basic CLV Formula:
CLV = Average Order Value × Purchase Frequency × Customer Lifespan
Let’s put numbers to it.
Say you run a SaaS tool at €49/month. Your average customer stays for 14 months before churning.
- Average Order Value: €49
- Purchase Frequency: 12 (monthly, so 12 per year)
- Customer Lifespan: 14/12 = 1.17 years
CLV = €49 × 12 × 1.17 = ~€688
That tells you each customer is worth roughly €688 over their lifetime. Now you have a hard number to work with.
For subscription businesses, there’s a simpler version:
CLV = Average Monthly Revenue per Customer ÷ Monthly Churn Rate
If your average monthly revenue per customer is €49 and your monthly churn rate is 7%:
CLV = €49 ÷ 0.07 = €700
Similar result, different route. Use whichever fits how your business model works.
CLV vs. Customer Acquisition Cost: The Ratio That Actually Matters
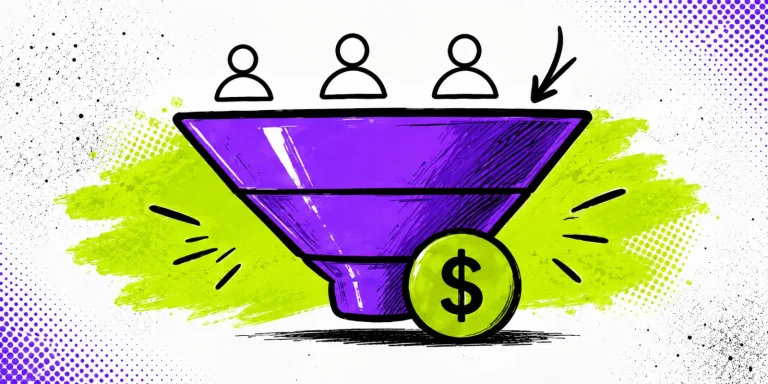
CLV on its own is just a number. It gets meaningful when you compare it to your Customer Acquisition Cost (CAC) – what you spend, on average, to bring in one new customer.
The ratio you want:
CLV:CAC of 3:1 or higher
That means for every €1 you spend acquiring a customer, you get €3 back over their lifetime. Below 3:1 and your margins are thin. At 1:1 you’re breaking even on acquisition alone – not accounting for support costs, infrastructure, or anything else.
If your CLV is €688 and your CAC is €300, your ratio is about 2.3:1 – workable but tight. If you can push CLV to €900 through better retention or upselling, suddenly the math looks a lot healthier without changing your acquisition spend at all.
This is why CLV is so powerful: it reframes growth. Instead of only asking “how do we get more customers?”, you start asking “how do we make the customers we have more valuable?”
CLV by Customer Segment
Aggregate CLV gives you a baseline. Segmented CLV tells you where to focus.
Breaking CLV down by customer type – industry, plan tier, acquisition channel, company size – often reveals dramatic differences. Some segments might show a CLV 3× higher than your company average. Others might be dragging the number down significantly.
Common segments worth calculating separately:
- By acquisition channel – are customers from paid search worth more or less than those from referral?
- By plan tier – do customers who start on the entry-level plan ever upgrade, or do they churn faster?
- By industry or use case – which verticals have the lowest churn and highest expansion revenue?
Once you know which segments carry the highest CLV, you can prioritise them in your marketing targeting, product roadmap, and customer success resources.
5 Ways to Improve Your CLV
The formula makes it clear where the levers are: increase what customers spend, increase how often they buy, or extend how long they stay. In practice, that looks like this:
1. Reduce churn. This is the highest-leverage move for subscription businesses. Even a 1–2% reduction in monthly churn compounds dramatically over 12 months. Identify why customers leave in the first 90 days and fix that before anything else.
2. Upsell and cross-sell strategically. The easiest sale is to an existing customer. If you have higher-tier plans or complementary products, make sure active customers know about them at the right moment – not as spam, but as a natural next step.
3. Improve onboarding. Customers who reach their “aha moment” quickly stick around longer. A structured onboarding flow that gets people to value fast is one of the most underrated retention tools.
4. Invest in support. Poor support is one of the top reasons customers churn – and you often don’t find out until it’s too late. Fast, competent support turns frustrated customers into loyal ones.
5. Segment and personalise. Sending the same message to every customer leaves money on the table. Customers who bought product A have different needs from those on product B. Treat them accordingly.
How CRM Helps You Track and Grow CLV
You can’t improve what you can’t see. A CRM system gives you the infrastructure to calculate, monitor, and act on CLV at scale.
Specifically, a CRM lets you:
- Track purchase history and revenue per customer over time
- Identify at-risk customers before they churn (based on engagement signals)
- Tag customers by segment so you can calculate CLV by cohort
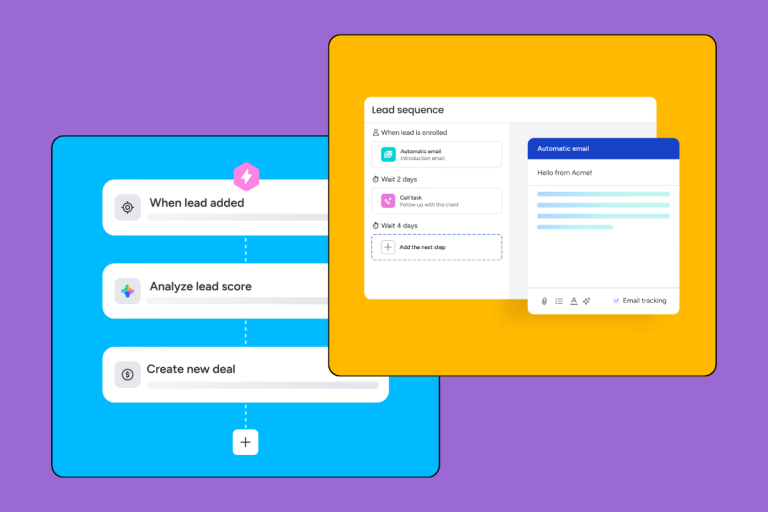
- Trigger automations for upsells, check-ins, and retention campaigns at the right moment
- Connect acquisition source data to lifetime revenue, so you know which channels produce the best customers – not just the most customers
[INTERNAL LINK: best CRM for small business]
[INTERNAL LINK: CRM features explained]
The best CRMs for tracking CLV will have built-in reporting, deal revenue tracking, and the ability to segment contacts by custom fields. If you’re evaluating options, check our [sales CRM ranking] to see which tools handle customer data the best.
Key Takeaways
- CLV is the total revenue a customer generates throughout their relationship with your business – not just their first purchase.
- The core formula: Average Order Value × Purchase Frequency × Customer Lifespan.
- The number that really matters is the CLV:CAC ratio. Aim for 3:1 or higher.
- Segmenting CLV by acquisition channel, plan tier, and customer type reveals where your most profitable growth is.
- Improving CLV is mostly about retention, not acquisition. Reduce churn first, then look at upsells and expansion revenue.
FAQ
What’s a good Customer Lifetime Value?
There’s no universal benchmark – it depends entirely on your business model and margins. What matters more is your CLV:CAC ratio. A 3:1 ratio is generally considered healthy; below 1:1 means you’re losing money on acquisition.
What’s the difference between CLV and LTV?
Nothing meaningful. CLV (Customer Lifetime Value), LTV (Lifetime Value), and CLTV (Customer Lifetime Value) all refer to the same metric. Different companies use different abbreviations; the calculation is the same.
How often should I recalculate CLV?
Quarterly is a reasonable cadence for most businesses. If you’re running a lot of experiments – new pricing, new onboarding flows, new acquisition channels – recalculate more frequently so you can see the impact.
Can CLV predict future revenue?
Broadly, yes. Multiplying your CLV by your current active customer count gives you a rough estimate of future revenue potential. It’s not a precise forecast, but it gives you a useful order-of-magnitude figure for planning.
How does churn rate affect CLV?
Directly and dramatically. In a subscription model, halving your churn rate roughly doubles your CLV. It’s the single most powerful lever available to most SaaS and subscription businesses.