
NPS stands for Net Promoter Score – a single-number metric that measures how likely your customers are to recommend your business to someone else. You ask one question, score the answers on a 0–10 scale, run a simple formula, and land on a number between −100 and +100. That’s it.
Simple concept.
But getting it right, and actually doing something useful with the result – is where most companies stumble.
This guide covers what NPS is, how it works, how to calculate it, what a good score looks like by industry, and how to use a CRM to act on the data instead of just collecting it.
What does NPS stand for?
NPS stands for Net Promoter Score. In a business context, it’s a customer loyalty metric – a way of measuring not just whether customers are satisfied, but whether they’d stake their reputation on recommending you.
The name comes from the idea of “promoters”: customers who actively spread positive word-of-mouth about your business. Net Promoter Score is the net count of those promoters minus the customers who actively work against you (detractors), expressed as a percentage-point number.
NPS in business vs. other meanings
A quick disambiguation: “NPS” means different things in different contexts. In India, NPS refers to the National Pension System – a retirement savings program. In the US, it’s also short for the National Park Service. If you’re searching for customer experience metrics, you want “Net Promoter Score NPS” or just “what is NPS in business.”
Throughout this guide, NPS means Net Promoter Score.
A brief history of Net Promoter Score
Fred Reichheld, a partner at Bain & Company, introduced NPS in a 2003 Harvard Business Review article titled “The One Number You Need to Grow.” He had spent years trying to find a single metric that correlated with actual business growth – revenue, referrals, repeat purchases – and landed on the recommendation question.
The concept spread fast. Within a few years, companies like Apple, American Express, and Intuit had adopted it as a core performance metric. Bain & Company now calls it the “Net Promoter System” – a broader management approach, not just a survey score.
It’s worth knowing the origin because it explains one of the criticisms you’ll hear: NPS was designed for B2C businesses with large customer bases where you can trust statistical averages. Applied to a 20-customer B2B company where two unhappy clients tank your score by 40 points, it gets messier.
How NPS works: promoters, passives, and detractors
The NPS survey asks one question: “On a scale of 0 to 10, how likely are you to recommend [company/product/service] to a friend or colleague?”
Respondents fall into three groups based on their answer.
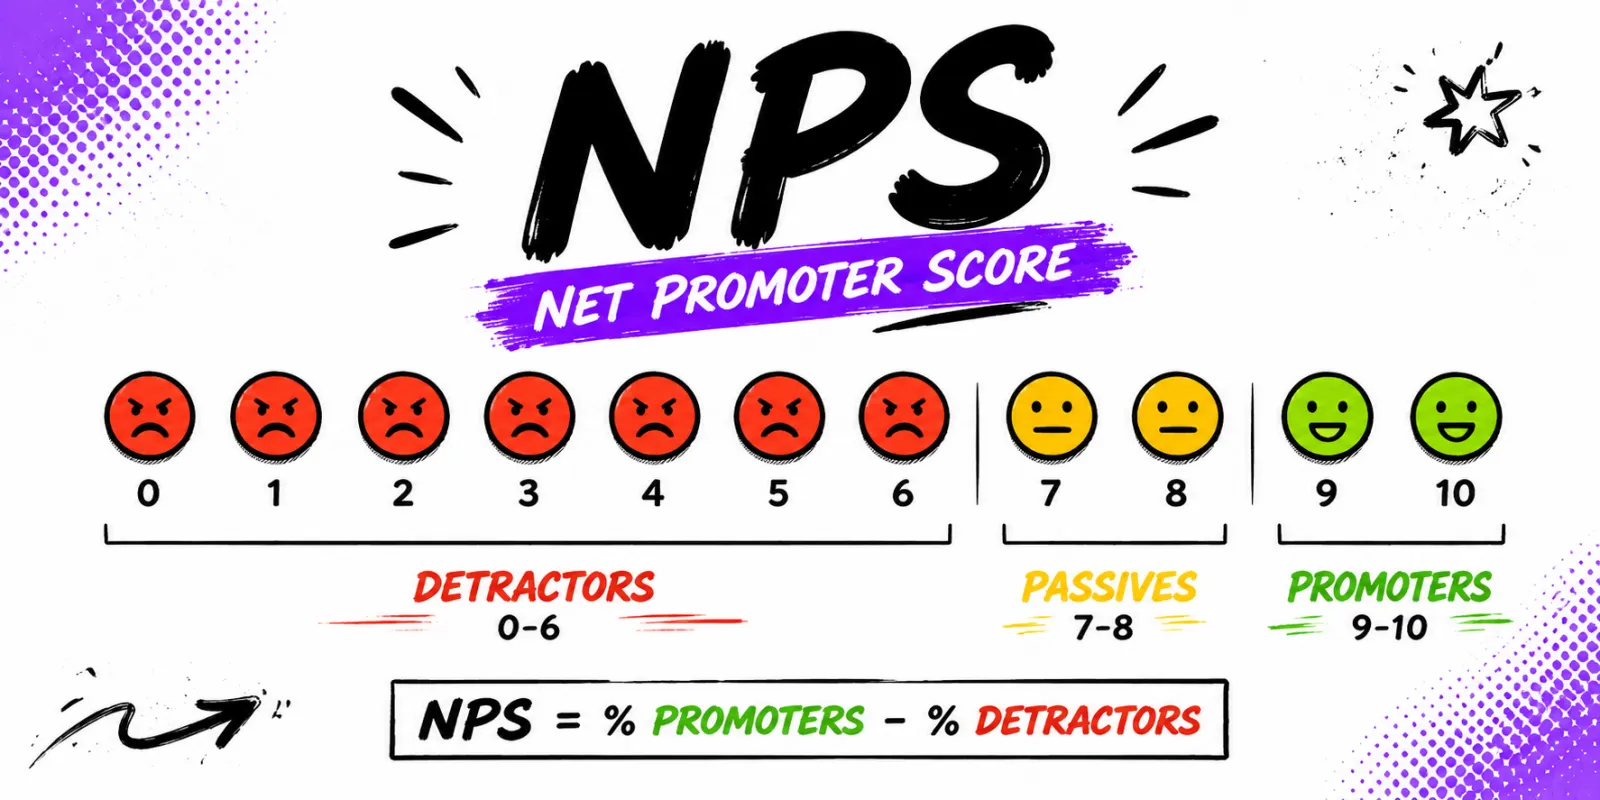
Promoters (9–10): your growth engine
Promoters scored 9 or 10. They’re not just satisfied – they actively tell other people about you. In our experience reviewing CRM tools and talking to sales teams, promoters are the customers who show up in your pipeline as warm referrals, who leave public reviews without being asked, and who stick around long enough to become your highest-lifetime-value accounts.
The goal isn’t just to count them. It’s to understand what made them promoters and replicate it.
Passives (7–8): the forgotten middle
Passives are satisfied but unenthusiastic. They gave you a 7 or 8 – not bad enough to complain, not good enough to recommend. They’re also the most likely to churn quietly when a competitor offers a slightly better deal or a lower price.
Most NPS systems ignore passives because they don’t factor into the formula. That’s a mistake. Passives are often the largest segment, and moving even a portion of them to promoters can shift your score by 10–15 points.
Detractors (0–6): the churn risk
Detractors scored 0 through 6. They’re unhappy, and some will say so publicly. Negative reviews, social media posts, word-of-mouth warnings to colleagues – detractors create real costs that don’t show up in your satisfaction dashboard.
A 6 and a 0 both count as detractors in the formula, which is one of NPS’s known limitations. Someone who gave you a 6 is mildly disappointed; someone who gave you a 0 is actively hostile. The number doesn’t distinguish between them.
How to calculate Net Promoter Score
Here’s the process, step by step.
The NPS formula
NPS = % Promoters − % Detractors
Passives are excluded. The result is always a whole number – there are no decimal NPS scores – and it ranges from −100 (every single respondent is a detractor) to +100 (every single respondent is a promoter).
NPS calculation example (step by step)
Say you send an NPS survey to 200 customers and get 100 responses:
- Send the survey. Ask: “On a scale of 0–10, how likely are you to recommend us to a friend or colleague?”
- Categorize the responses. From your 100 responses: 55 scored 9–10 (Promoters), 25 scored 7–8 (Passives), 20 scored 0–6 (Detractors).
- Calculate percentages. Promoters: 55/100 = 55%. Detractors: 20/100 = 20%. Passives: 25/100 = 25% (not used in the formula).
- Apply the formula. NPS = 55% − 20% = +35.
A score of +35 is solid for most industries – more on benchmarks below.
One thing to check: your response rate. In this example, 100 out of 200 customers responded – a 50% response rate, which is strong. If only 10 out of 200 responded, your NPS number might be statistically meaningless. We’ll cover response rates in the survey section.
What is a good NPS score? (Benchmarks by industry)
“Is 35 a good NPS score?” depends entirely on what industry you’re in.
NPS score ranges: what the numbers mean
| Score range | Interpretation |
|---|---|
| Below 0 | More detractors than promoters. Something is broken. |
| 0–30 | More promoters than detractors. Room to improve. |
| 30–50 | Good. Solid customer loyalty. Most healthy mid-market businesses land here. |
| 50–70 | Excellent. Strong word-of-mouth, low churn risk. |
| 70+ | World-class. Apple, Chewy. |
Any positive NPS – even a +5 – means you have more promoters than detractors. That’s a reasonable starting point. The question is whether you’re improving over time, and whether you’re competitive within your industry.
Industry benchmarks
NPS benchmarks vary significantly by sector. Industries with captive customers (telecoms, cable, insurance) tend to score lower because the customer has less choice. Industries where customers chose you enthusiastically (direct-to-consumer brands, SaaS products with strong product-market fit) tend to score higher.
Rough benchmarks based on published industry data:
| Industry | Typical NPS range |
|---|---|
| SaaS / software | 30–50 |
| E-commerce | 45–65 |
| Financial services | 20–40 |
| Healthcare | 20–40 |
| Telecom / cable | −10 to 20 |
| Retail | 40–60 |
| Professional services | 40–60 |
| Hospitality / travel | 30–60 |
The cleanest benchmark is your own score over time. A company improving from +18 to +34 in 12 months is doing something right, regardless of what the industry average says. Chasing a competitor’s NPS number without understanding the context behind it is a distraction.
One more thing: sample size matters more than the absolute score. A +72 from 8 responses is not the same as a +72 from 800 responses. Before you celebrate a high score, check that you have enough data to trust it.
Transactional vs. relational NPS: what’s the difference?
This distinction is underused – most NPS guides lump everything together and you end up measuring the wrong thing for the wrong reason.
Transactional NPS is sent immediately after a specific interaction: a purchase, a support call, an onboarding session. It measures how that single moment landed. You’re answering the question: “Did this specific experience move customers toward recommending us or away from it?”
Relational NPS is sent on a regular schedule – typically quarterly or twice a year – independent of any specific event. It measures the overall health of the customer relationship. You’re answering: “How do customers feel about us in general, right now?”
Most companies need both.
Use transactional NPS to identify which touchpoints are creating detractors. If your post-support NPS is −20 but your overall relational NPS is +35, you have a customer service problem that isn’t dragging down your overall number yet – but it will.
Use relational NPS to track relationship health over time and catch drift before it becomes churn. A company whose relational NPS drops from +45 to +28 over two quarters should be asking hard questions, even if no individual metric looks alarming.
The mistake we see most often: companies run transactional NPS after every touchpoint, generate a mountain of data, and never look at any of it systematically. The data collection is easy. The follow-through is the hard part.
How to run an NPS survey
The NPS question and follow-up questions
The standard NPS question is:
“On a scale of 0 to 10, how likely are you to recommend [Company/Product/Service] to a friend or colleague?”
That’s the only question that generates your NPS score. Everything else is optional follow-up.
But the follow-up is where the actual insight lives. After the rating question, add:
- For detractors (0–6): “What’s the primary reason for your score?”
- For promoters (9–10): “What do you value most about [product/service]?”
- For all respondents (optional): “Can we follow up with you about your feedback?”
The open-text responses from detractors are worth more than the score itself. A −15 NPS tells you something is wrong. The open-text tells you whether it’s pricing, product quality, support speed, or something else entirely. You cannot fix what you cannot name.
When to send NPS surveys
Timing matters more than most teams realize.
For transactional NPS, send within 24–48 hours of the interaction – close enough that the experience is fresh, far enough that any immediate frustration (a support ticket that just closed) has settled slightly.
For relational NPS, most companies send quarterly. Every six months is acceptable for customers with long engagement cycles (annual contracts, enterprise relationships). Monthly is usually too frequent – you’ll see survey fatigue and response rates drop.
One timing mistake to avoid: sending relational NPS surveys right after a renewal or upsell. Customers who just recommitted tend to score higher, which distorts your reading of overall relationship health. Run relational NPS at a fixed calendar point, not tied to commercial events.
NPS survey response rates: what to expect
Email-based NPS surveys typically see response rates of 20–30%. In-app surveys (triggered inside a product or website) can reach 40–60% because the friction is near zero. Post-call surveys tend to be higher still.
Rates below 10% are a signal – not necessarily that customers hate you, but that your survey delivery has problems. Check: Is it going to spam? Is the email personalized or does it look automated? Is it mobile-friendly? Is it being sent at a reasonable hour for your customer’s time zone?
Response rate also affects the reliability of your NPS number. As a rough rule of thumb, you need at least 50 responses before your NPS score is worth acting on. Under 20 responses, treat the score as directional noise, not a performance metric.
NPS vs. CSAT vs. CES: which metric should you track?
You’ll often hear these three together. They measure different things and serve different purposes.
NPS (Net Promoter Score) measures long-term loyalty and the likelihood of recommendation. It’s a relationship-level metric, most useful for tracking overall customer health over time.
CSAT (Customer Satisfaction Score) measures satisfaction with a specific interaction or experience. The question is typically: “How satisfied were you with [X]?” scored on a 1–5 or 1–10 scale. CSAT is transactional by nature – it tells you whether a particular touchpoint worked.
CES (Customer Effort Score) measures how much effort a customer had to exert to get something done: resolve an issue, complete a purchase, find information. The question is usually: “How easy was it to [do X] today?” CES is particularly predictive of churn – high effort is one of the strongest indicators that a customer will leave.
Which one should you track? Honest answer: all three serve different purposes and ideally you’d use all three. But if you’re starting out and can only instrument one:
- Use NPS if you want a relationship-level health metric and a benchmark to track over time.
- Use CSAT if your priority is improving specific interactions (onboarding, support, checkout).
- Use CES if churn reduction is your main focus – especially in support-heavy products.
For most SMBs using a CRM, NPS is the right starting point because it’s the easiest to connect to commercial outcomes: customer lifetime value, churn rate, referral volume. We’ll come back to this in the next section.
How to improve your NPS score
Collecting NPS data is the easy part. Acting on it is where the work is.
Act on detractor feedback first
The fastest way to improve your NPS is to close the loop with detractors. This means:
- Identify every respondent who scored 0–6.
- Have someone reach out personally – a short, non-scripted message acknowledging their score and asking what happened.
- Log what you hear. Look for patterns. If ten detractors in a row mention the same onboarding problem, that’s your first fix.
- Fix the underlying issue, then follow up with the original detractors to let them know.
This process is called “closed-loop feedback” and it’s where NPS programs pay off. Companies that close the loop consistently see both NPS improvement and churn reduction – because reaching out to an unhappy customer, listening, and fixing the problem often converts a detractor into a passive or even a promoter.
The mistake is treating NPS as a reporting exercise. Scores go into a dashboard, the team reviews them in a quarterly meeting, and nothing changes. If your NPS process doesn’t include someone whose job it is to call back detractors, you’re running a survey program, not a customer experience program.
How a CRM helps you track and improve NPS
This is where most NPS guides stop – and where CRM Pickle’s angle starts.
A CRM (customer relationship management system) is where you manage ongoing customer relationships. When you connect your NPS data to your CRM, you stop looking at NPS as a standalone score and start treating it as customer-level signal you can act on.
Here’s what that looks like in practice:
HubSpot has native NPS survey functionality in its Service Hub. When a customer submits an NPS response, it’s logged directly on their contact record. You can build workflows that automatically create tasks for your team when a detractor submits – no manual export needed. Promoters can be enrolled in referral sequences or review request flows automatically.
Salesforce doesn’t have native NPS but connects natively with Qualtrics (which Salesforce acquired) and with Medallia, Delighted, and other NPS tools. You can map NPS scores to Account or Contact records, surface them in your pipeline view, and trigger alerts when a key account’s score drops.
Freshsales and Pipedrive both support NPS data through integrations with survey tools like SurveyMonkey, Typeform, and Delighted via Zapier or native connectors. The workflow is similar: score comes in, maps to a contact, triggers an action.
The value of CRM integration isn’t just visibility. It’s timing. When a sales rep can see that a customer scored you a 4 last month before a renewal call, they go into that conversation differently – with information instead of assumptions. When an account manager sees a previously happy account’s NPS drop from 8 to 5 between quarters, they can reach out proactively instead of reacting to a churn notice.
NPS data sitting in a survey tool is interesting. NPS data living inside your CRM, attached to real customer records, is operational.
Employee NPS (eNPS): what it is and why it matters
NPS isn’t only for customers. The same methodology applied internally is called eNPS – Employee Net Promoter Score.
The eNPS question is: “On a scale of 0 to 10, how likely are you to recommend [Company] as a place to work to a friend or colleague?”
The scoring is identical: 9–10 are promoters, 7–8 are passives, 0–6 are detractors. The formula is the same: eNPS = % Promoters − % Detractors.
eNPS benchmarks are lower than customer NPS benchmarks. An eNPS of +10 is considered reasonable. Above +30 is strong. Many well-run companies sit in the +20 to +40 range.
Why does it matter for a CRM-focused site? Because the correlation between employee experience and customer experience is well-documented. Bain & Company’s own research found that companies with higher eNPS scores tend to outperform on customer NPS too. A customer service team that doesn’t want to be there will not close the loop on detractor feedback with any urgency.
Some caveats worth knowing. eNPS surveys need anonymity guarantees to generate honest data – employees who think their score will be traced back to them will not give honest answers. And like customer NPS, eNPS is most useful when you follow it with open-text questions and actually act on what you hear.
One limitation Qualtrics flags: eNPS is less granular than full employee engagement surveys. It tells you whether employees would recommend the company, not why they would or wouldn’t. If you need to diagnose specific cultural issues – management quality, compensation, career growth – you need more than one question. eNPS is a health indicator, not a diagnostic tool.
FAQ: Net Promoter Score
What is a good NPS score?
Any score above 0 means you have more promoters than detractors – that’s the baseline. A score of 30–50 is generally considered good for most industries. Above 50 is excellent. Above 70 is world-class and rare outside consumer-brand darlings (think Costco, Apple, Chewy).
The most useful benchmark is your own trend over time. Comparing your score to an industry average is directionally helpful; obsessing over it is a distraction.
What is the NPS formula?
NPS = % Promoters − % Detractors. Promoters are respondents who scored 9 or 10; detractors scored 0–6. Passives (7–8) are not included in the calculation. The result is a whole number between −100 and +100.
What is the difference between NPS and CSAT?
NPS measures long-term loyalty and the likelihood of recommendation. CSAT (Customer Satisfaction Score) measures satisfaction with a specific interaction. Use NPS to track overall relationship health over time; use CSAT to evaluate individual touchpoints like support calls, onboarding sessions, or purchases.
What are the two types of NPS?
Transactional NPS is sent right after a specific interaction to measure how that moment landed. Relational NPS is sent on a regular schedule – quarterly or twice a year – to measure overall relationship health. Most companies that run a serious NPS program use both.
What is a good NPS survey response rate?
20–30% is solid for email-based surveys. In-app surveys typically see 40–60% because the friction is near zero. Below 10% usually points to a delivery problem (spam filters, poorly written subject lines, wrong send time) or genuine survey fatigue. Check your mechanics before assuming the low rate reflects customer sentiment.
What is eNPS?
eNPS is the Employee Net Promoter Score – the same 0–10 recommendation question applied to employees about your company as a workplace. It uses the same formula. A score above +10 is generally considered positive. eNPS is a useful health signal but not a substitute for full employee engagement surveys when you need to diagnose specific issues.
The bottom line on NPS
NPS is not magic. A single number can’t capture the full complexity of your customer relationships, and a high score doesn’t protect you from churn if you’re not acting on what you hear.
But used correctly – with closed-loop follow-up, proper segmentation between transactional and relational programs, and integration with a CRM where the data actually drives action – NPS is one of the more honest signals you have about where your business stands with its customers.
Start by tracking it consistently. Move the trend line. Then build the workflows to act on detractor feedback before customers leave instead of after.
If you’re looking for a CRM that integrates well with NPS tools, the HubSpot review and Salesforce review are good starting points – both have solid native or partner NPS integrations. And if you want to understand how NPS connects to long-term revenue, our guide to customer lifetime value covers the overlap.