
Most founders inflate their TAM. We’ve watched it happen on pitch calls, on coffee chats, in spreadsheets that hit our inbox. Somebody multiplies a Statista number by an industry growth rate, lands on a $42 billion figure, and calls it a market opportunity. The investor on the other end has seen that exact slide forty times this month.
So this isn’t another vendor’s TAM SAM SOM glossary. We’re going to walk you through the three numbers, show you a worked example using a real-ish business, point you at where the data actually lives (spoiler: a lot of it is in your CRM), and hand you a template. If you’re prepping for a Series A or just trying to figure out whether the side project is worth quitting for, the answers below are the ones we’d want from a finance friend over a beer.
What is TAM, SAM, SOM?
TAM, SAM, and SOM are three market-sizing numbers that describe the same opportunity at different zoom levels:
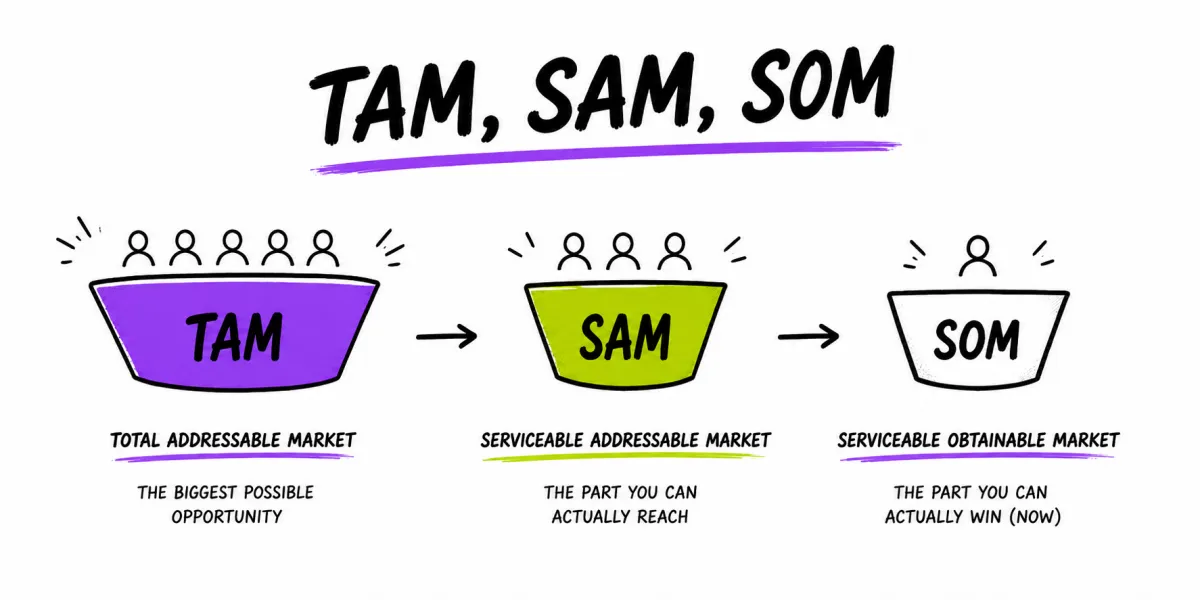
- TAM (Total Addressable Market) – the total annual revenue available if you somehow won 100% of demand for your product. Theoretical maximum.
- SAM (Serviceable Addressable Market) – the slice of TAM your business can realistically reach, given your geography, product, language, and channels.
- SOM (Serviceable Obtainable Market) – the part of SAM you can actually capture in the short term, usually 12 months, given your team, budget, and competitive position.
TAM is the dream. SAM is the strategy. SOM is the plan. You need all three because each one answers a different question for a different audience.
TAM vs SAM vs SOM: side-by-side comparison
Here’s the cheat sheet, no fluff:
| Metric | What it answers | Who cares | Typical size |
|---|---|---|---|
| TAM | How big could this get? | Investors, board | Billions for VC-scale, hundreds of millions for SMB |
| SAM | Where can we play right now? | Marketing, sales leadership | A fraction of TAM, usually 10–40% |
| SOM | What will we win this year? | Finance, the CEO | A fraction of SAM, usually 1–15% |
Memorize the funnel and the rest becomes math.
TAM: Total Addressable Market
What TAM really tells you (and what it doesn’t)
TAM gives you the ceiling. It tells investors how big the prize is if you somehow eliminate competition, geography, and your own constraints. It does not tell you what you’ll bill next quarter. Founders get into trouble when they treat TAM as a revenue forecast – it isn’t. It’s a sanity check on whether the market is worth the trouble.
A useful frame: if your TAM is under 100 million, you’re not building a VC-fundable company. That’s fine, plenty of beautiful businesses sit under that number. But know what you’re walking into before you write that “X billion opportunity” line in your deck.
How to calculate TAM: top-down, bottom-up, value theory
Three methods. Pick the one that fits your data.
Top-down. Start with a published industry number from Gartner, IDC, Statista, IBISWorld, or a government source. Then narrow down with percentages until you land on your segment. Quick to do, easy for investors to follow. The downside: garbage in, garbage out. A 2019 report on the “global CRM market” tells you almost nothing about CRM-for-real-estate-agents in Texas.
Bottom-up. Count the customers and multiply by what each one pays you per year. Number of potential buyers × average annual revenue per buyer = TAM. This is the method most VCs trust because it’s defensible. It also forces you to know your numbers.
Value theory. Used when the product is so new there’s no obvious comparison. You estimate how much value you create for the customer, then assume you can capture some percentage of that value. It’s the riskiest method because the assumptions stack up fast. Only use it when the other two genuinely don’t work.
Most pitch decks should lead with bottom-up and use top-down as a sanity check. If the two methods produce wildly different numbers, you have a problem worth investigating before the investor finds it.
TAM example: a five-person sales agency
We’ll build one continuous example so the SAM and SOM math actually connects. Meet Inkpen Sales – a fictional five-person outbound sales agency selling to B2B SaaS founders in the United States. They charge $5,000 per month per client on a 6-month minimum.
Bottom-up TAM:
- US-based B2B SaaS companies with 10–100 employees: roughly 25,000 (per the latest census + Crunchbase). This is the buyer profile that hires outsourced sales.
- Average annual contract value: $5,000 × 12 = $60,000.
TAM = 25,000 × $60,000 = $1.5 billion.
Top-down sanity check: the global B2B sales outsourcing market sat around $20 billion in 2024 (Grand View Research). The US slice is roughly 35%, and the SMB SaaS sub-slice is maybe 20–25%. That puts the relevant market at $1.4–1.75 billion. Close enough – our bottom-up number passes the smell test.
SAM: Serviceable Addressable Market
How to narrow your TAM into a realistic SAM
SAM is where TAM meets reality. You’re stripping out everything you can’t reach today: countries you don’t serve, customer segments your product doesn’t fit, deals too big or too small for your model, languages you don’t support.
A clean way to do it: start with TAM, then apply three filters in order:
- Geographic filter. Where can you actually sell? If you only operate in the US and don’t have international payment infrastructure, you’re not addressing Europe yet. Cut.
- Product-fit filter. Which sub-segments need exactly what you sell, in exactly the shape you sell it? A 5,000-person enterprise probably doesn’t want what a 30-person scrappy SaaS wants. Cut.
- Channel filter. Can you reach them affordably? If 80% of your TAM only buys through procurement RFPs and you don’t have a procurement team, you can’t address them. Cut.
What’s left is SAM. Be honest in the cuts – nobody wins by inflating a SAM nobody can actually serve.
SAM example: continued from Inkpen Sales
Inkpen serves US companies only. They specialize in B2B SaaS founders selling deals between $5K and $50K ACV. They sell via founder-led outbound (cold email, LinkedIn, podcast appearances) – not RFPs, not procurement.
Filter the 25,000 TAM companies:
- US-only: 25,000 (no cut, TAM was already US).
- Companies with deal sizes in the $5K–$50K range: roughly 60% of B2B SaaS firms in that headcount band (per a 2024 OpenView SaaS Benchmarks survey). 25,000 × 0.6 = 15,000.
- Companies founder-accessible via outbound (not yet enterprise, no procurement walls): maybe 70% of those. 15,000 × 0.7 = 10,500.
SAM = 10,500 × $60,000 = $630 million.
That’s the realistic playable market for Inkpen this year. Notice it’s already a different conversation than the $1.5B TAM – more specific, more defensible, and more useful for actual planning.
SOM: Serviceable Obtainable Market
The SOM formula (and why most founders get it wrong)
The standard formula:
SOM = SAM × (your realistic market share in 12 months)
The mistake is treating “realistic market share” as a vibe. Most pitch decks pick 1% because it sounds humble. That’s not analysis, that’s flinching. You need to derive the percentage from something real.
If you already have customers, your SOM comes straight out of your CRM. Take last year’s revenue, divide by last year’s SAM, and that’s your starting market share. Then adjust for whatever changes this year – new hires, ad spend, a competitor folding, a new product feature. Done.
If you’re pre-revenue, you have to build SOM from constraints:
- How many leads can your sales team realistically handle?
- What’s your average win rate based on early conversations or industry benchmarks?
- What’s the average sales cycle and contract size?
Multiply those out and you get a revenue ceiling that has nothing to do with “1% of the market” hand-waving. It’s tied to actual operational capacity.
For more on connecting unit economics to the SOM number, our breakdown of customer acquisition cost shows the math.
SOM example: 12-month realistic target
Back to Inkpen. They have two AEs and a founder doing sales. Each AE can manage ~25 active outbound conversations a month. Founder runs another 15. That’s 65 active conversations a month, 780 a year.
Historical win rate (from year 1): 8%. Average client lifetime: 9 months at $5K/mo = $45,000.
Inkpen’s 12-month bookings ceiling:
- 780 conversations × 8% win rate = 62 closed clients.
- 62 × $45,000 = $2.79 million in booked revenue.
SOM = $2.79M against a $630M SAM = roughly 0.4% market share.
That’s the honest number. Half a percent feels small, but it’s the number Inkpen’s bank account will actually see. Compare it to the 1.5 billion TAM and you get a sense of why pitch decks are so seductive – they let you talk about the big number while quietly hoping nobody asks about the small one.
If you’re tracking how that 62-deal target moves through stages, our guide to sales pipeline management walks through the operational side.
Where to get the numbers (without making them up)
This is the part nobody else covers. Calculation methods are easy. Knowing where the inputs come from is harder.
Pre-revenue: industry reports, census data, trade associations
If you don’t have customers yet, here’s the data stack we’d use in order of trust:
- Government statistics. US Census Bureau, BLS, SBA. Free, comprehensive, and updated annually. Use these for company counts, employee bands, and revenue tiers. Boring but reliable.
- Trade association reports. Industry-specific groups publish member surveys – SaaSCAN, OpenView SaaS Benchmarks, the Sales Hacker reports, the Pavilion State of Sales report. These give you the unit economics (ACV, win rates, churn) you can multiply against the census company counts.
- Industry analyst firms. Gartner, Forrester, IDC, Grand View Research. Pricey if you buy them direct, but plenty of free summary stats float around in press releases. Use them for cross-check, not for the primary number.
- Public competitor disclosures. S-1 filings, public company 10-Ks, and earnings calls are a goldmine. If a competitor reports $400M in revenue and you estimate 10% market share, your TAM is roughly $4B without needing a single analyst report.
What to avoid: anything sourced “according to a recent study” with no citation. If you can’t link to the source, the investor can’t either, and that’s where trust breaks.
Post-revenue: pulling SAM and SOM from your CRM
Once you have customers, your CRM is the single best market-sizing tool you own. Most founders don’t realize this because they’re using their CRM as a contact list, not a data set.
What to pull:
- Win rate by segment. Filter closed-won and closed-lost by industry, company size, geography. The ratios tell you which slices of SAM you actually convert. Re-weight SAM accordingly.
- Average deal size by segment. Don’t use the global average. The 50-person company pays differently than the 500-person company. Tag and segment.
- Sales cycle by segment. A 90-day cycle in healthcare vs a 14-day cycle in marketing tech changes how many deals fit in a year. SOM math depends on this.
- Lost-deal reasons. If 40% of losses are “no budget,” your SAM has too many companies in it that can’t afford you. Cut them out.
A well-maintained pipeline is the cheapest market research you’ll ever do. If you’re a founder still juggling spreadsheets, our review of the best CRM for startups covers picks that won’t blow the budget.
The 5 most common TAM SAM SOM mistakes (and how to avoid them)
We’ve reviewed enough pitch decks to know where founders trip. Here are the five mistakes we see weekly, with the fixes.
1. Treating TAM as revenue potential. “We’re going after a $5 billion market” sounds great until the investor asks for your SOM. Pair every TAM number with SAM and SOM in the same sentence. Always.
2. Top-down only. Multiplying global industry numbers by percentages with no bottom-up validation. Investors recognize this in three seconds. Even a rough bottom-up calculation – number of accounts × average ACV – is more credible than the prettiest top-down chart.
3. Ignoring competitive saturation. If three players own 80% of the market already, your SOM ceiling is whatever you can carve out of the remaining 20%. Most founders skip this analysis and pretend the market is fresh. It rarely is.
4. Using old data. A 2019 industry report describing a 2018 market is useless in 2026. Markets shift. Always show your data source and date. If the data is older than two years, flag it and explain how you adjusted.
5. Inflating SAM to look more reachable. SAM should be smaller than TAM by a meaningful margin – usually 60–90% smaller. If your SAM is 95% of your TAM, you haven’t actually filtered. You’ve copied TAM and renamed it.
The pattern across all five: founders try to make the numbers look bigger to seem more ambitious. It backfires. The credible number always wins the meeting.
Free TAM SAM SOM template (download)
We built a Google Sheets and Excel-compatible template that runs the full calculation – TAM, SAM, SOM in both top-down and bottom-up formats, with a sales pipeline calculator hooked into the SOM cell.
The template includes:
- Pre-filled formulas for both methods
- Source citation column (because data without a source is just a guess)
- A pipeline-derived SOM tab for post-revenue founders
- A worked example mirroring the Inkpen Sales walkthrough above
Grab it, drop your numbers in, and you have a defensible market-sizing model in under an hour. Available here.
TAM SAM SOM for pitch decks: what investors actually look for
You’re not winning a Series A because your TAM is big. You’re winning it because your SOM is believable and your path from SOM to SAM to TAM is clear.
What investors actually skim for on the market slide:
- A SAM that’s tight enough to be specific. “B2B SaaS founders in the US with 10–100 employees” beats “the SaaS market.”
- A SOM derived from real constraints. Lead capacity, win rates, headcount, ad budget. Not “we’ll capture 1%.”
- Source citations on every number. A footnote per data point is more reassuring than a footer that says “various industry sources.”
- A growth narrative. How does SAM expand over time? New geographies, new product lines, new segments? That’s the story behind the math.
- What you’d cut first. If forced, which part of SAM do you walk away from? Founders who can answer that show they’ve thought past the deck.
A clean slide with $50M TAM, $20M SAM, $2M SOM and rock-solid sources beats a $5B TAM with hand-waving every single time. The pickle is: investors fund the SOM, not the TAM.
Frequently asked questions
What is TAM, SAM, and SOM?
TAM (Total Addressable Market) is the total revenue you’d earn if you sold to every possible customer. SAM (Serviceable Addressable Market) is the slice of TAM you can realistically target based on your geography, product, and business model. SOM (Serviceable Obtainable Market) is the chunk of SAM you can actually capture in the short term given your team size, budget, and competition.
How do you differentiate between TAM, SAM, and SOM?
Think of it as a funnel. TAM is theoretical – every potential buyer on Earth. SAM narrows that to people you can actually serve. SOM narrows again to what you can win in the next 12 months. TAM tells investors the opportunity is big. SAM tells your team where to focus. SOM tells finance what to budget.
How do you calculate SOM?
Take your SAM, then apply a realistic market-share percentage based on your pipeline, win rate, sales cycle, and competition. The fast formula is: SOM = SAM × (your realistic market share in 12 months). If you have CRM data, derive the percentage from last year’s market share. If you don’t, use 1–5% for crowded markets and 5–15% for emerging ones, then defend the number with the constraints – team size, ad budget, geographic reach.
What is the point of TAM SAM SOM?
Three things. One, it forces you to do real homework on who actually buys your product. Two, it sets realistic revenue goals so you don’t burn out the team chasing impossible numbers. Three, it helps investors and lenders trust your business plan. A founder who can defend a SOM is taken more seriously than one who waves at a $50 billion TAM.
What is a good TAM for a VC-backed startup?
Most VCs want to see a TAM of at least $1 billion before they’ll write a check. The reason is fund math, not your business. A typical VC fund needs a handful of portfolio companies to return the entire fund, which means each one has to plausibly hit a billion-dollar valuation. A small TAM caps that ceiling. For bootstrapped or angel-backed businesses, a $50–300 million TAM is plenty.
Can TAM and SAM be the same?
Almost never. If TAM and SAM are equal, you’re claiming you can serve every customer in the entire market – no geographic limits, no language barriers, no product gaps, no competition. That’s not a market analysis, that’s a fantasy. The only edge case is a hyper-niche product where the niche itself is so specific that everyone in TAM is reachable. Even then, SAM usually trims something off.